GeoWells — B2B Software Brochure
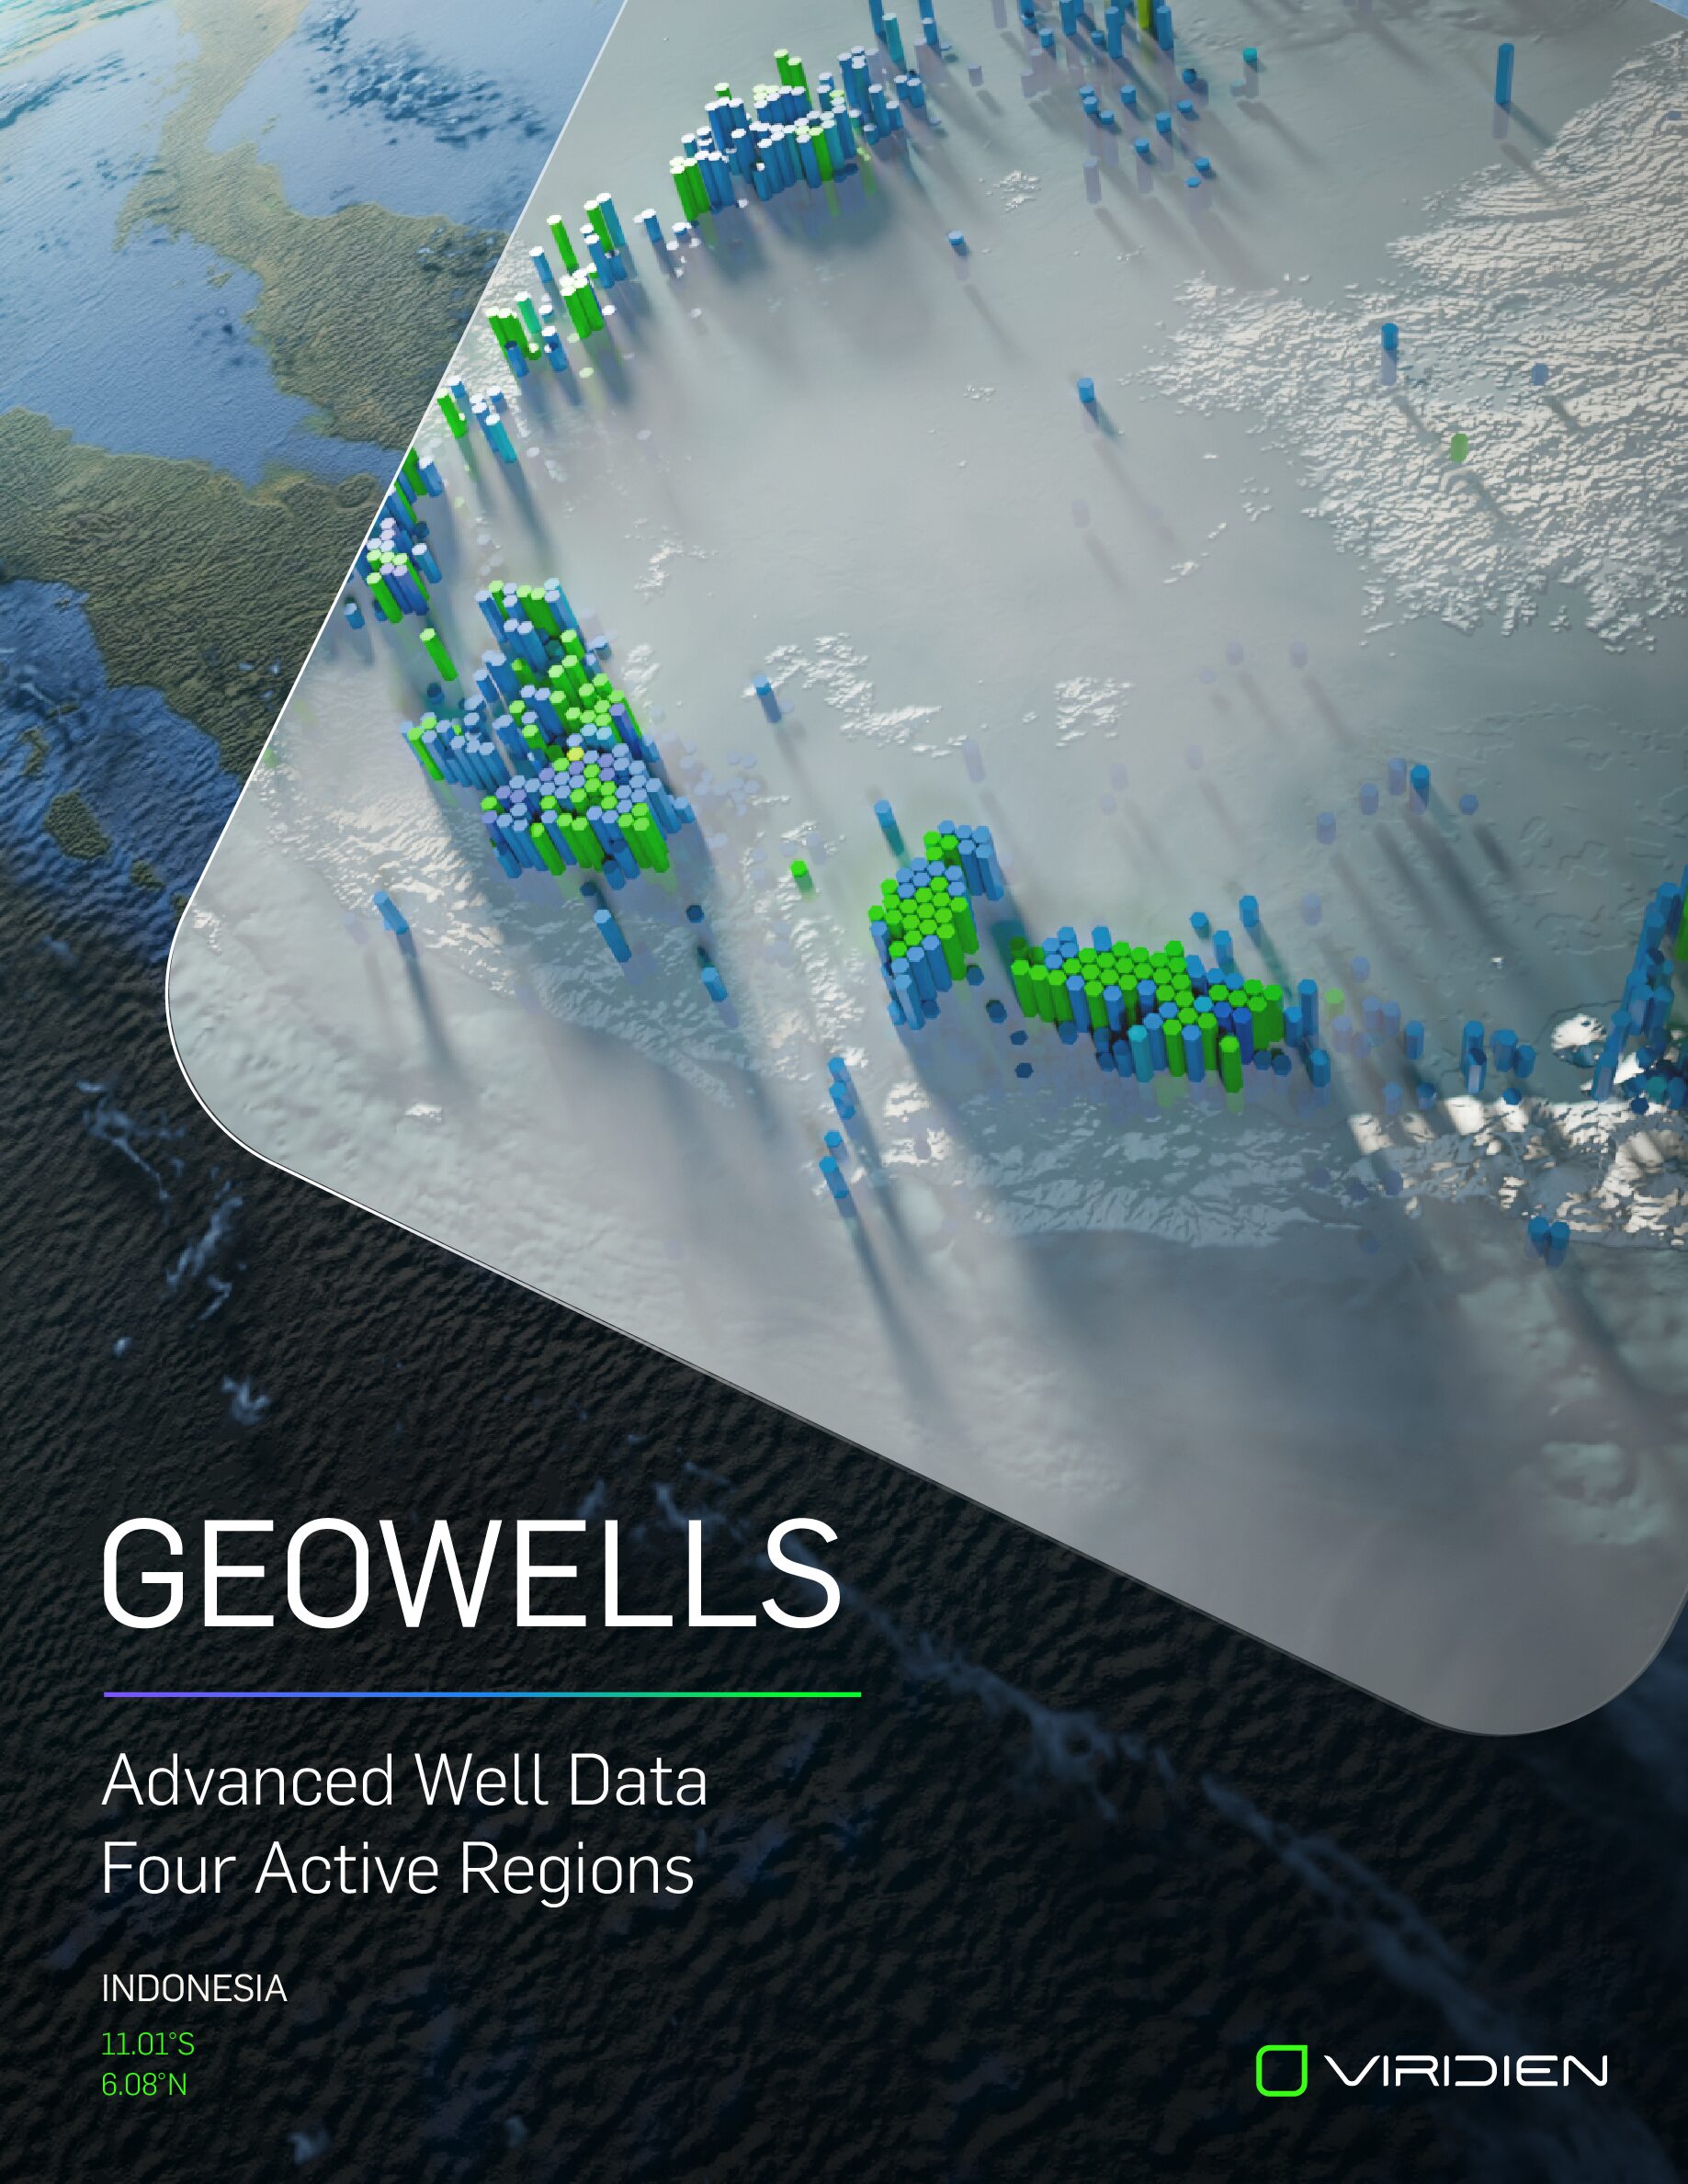
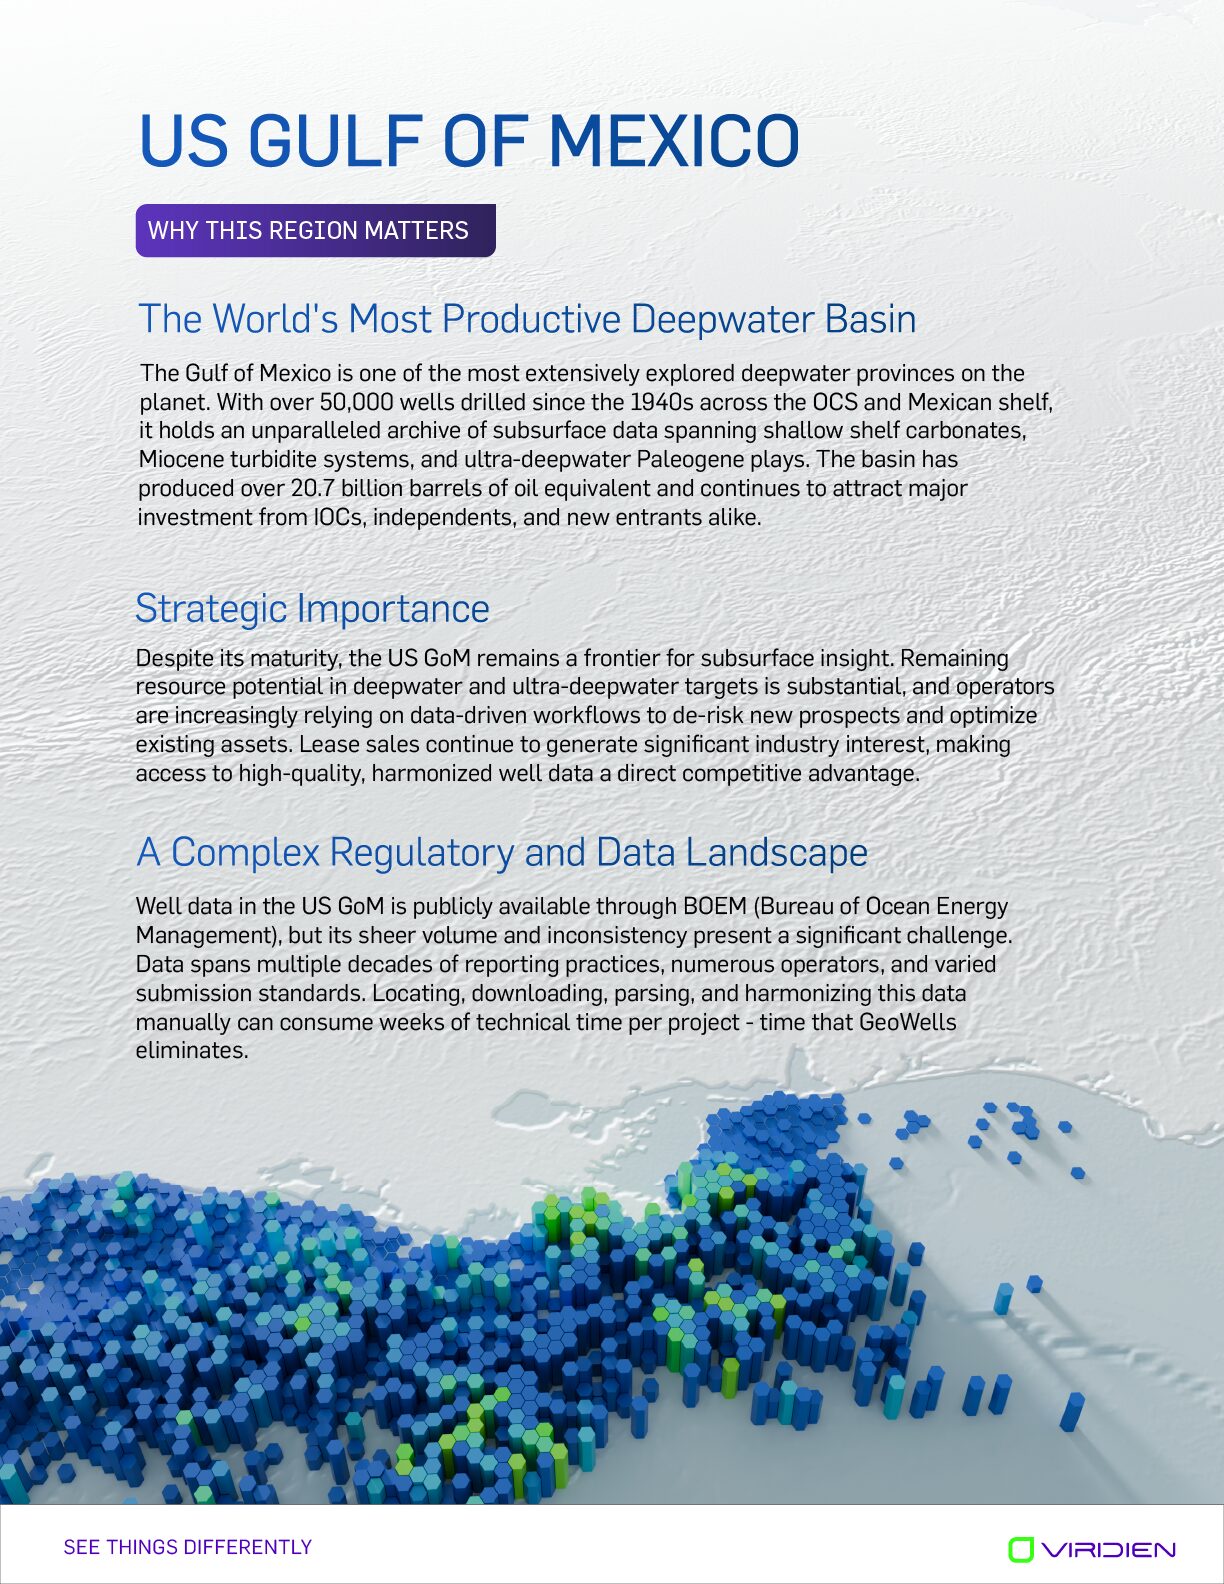
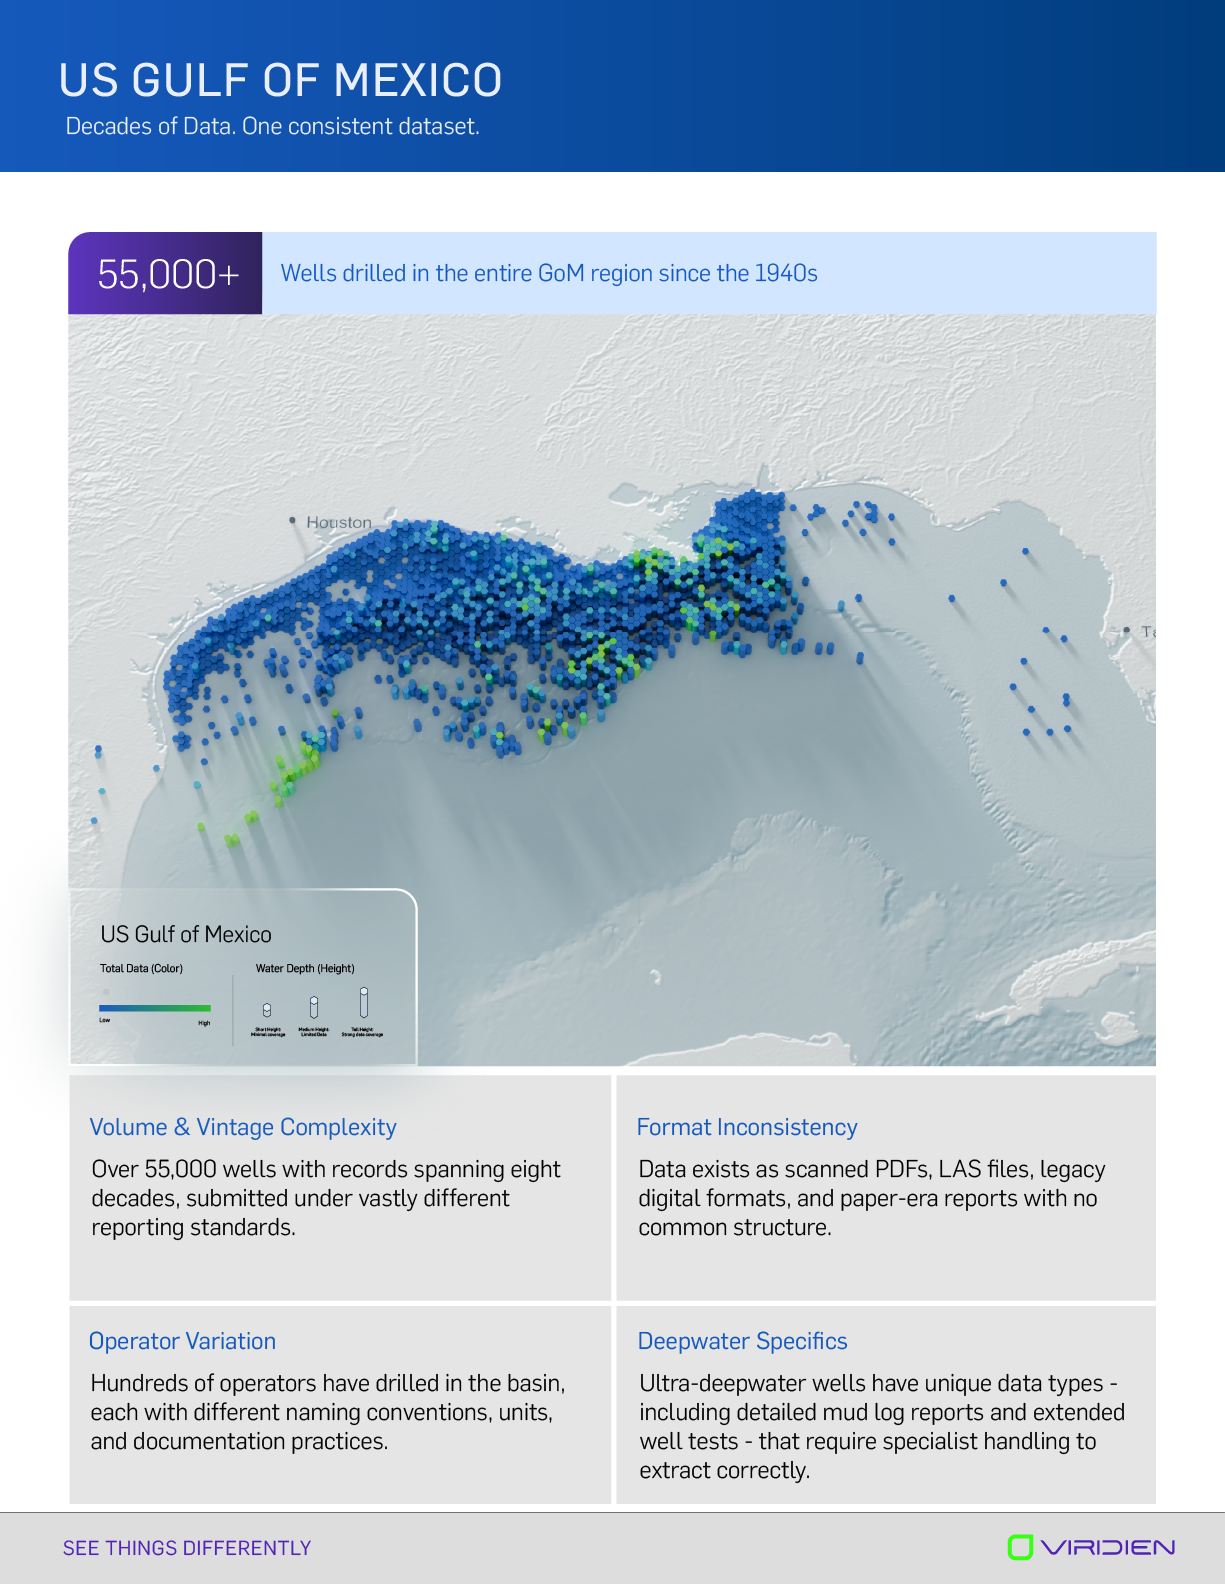
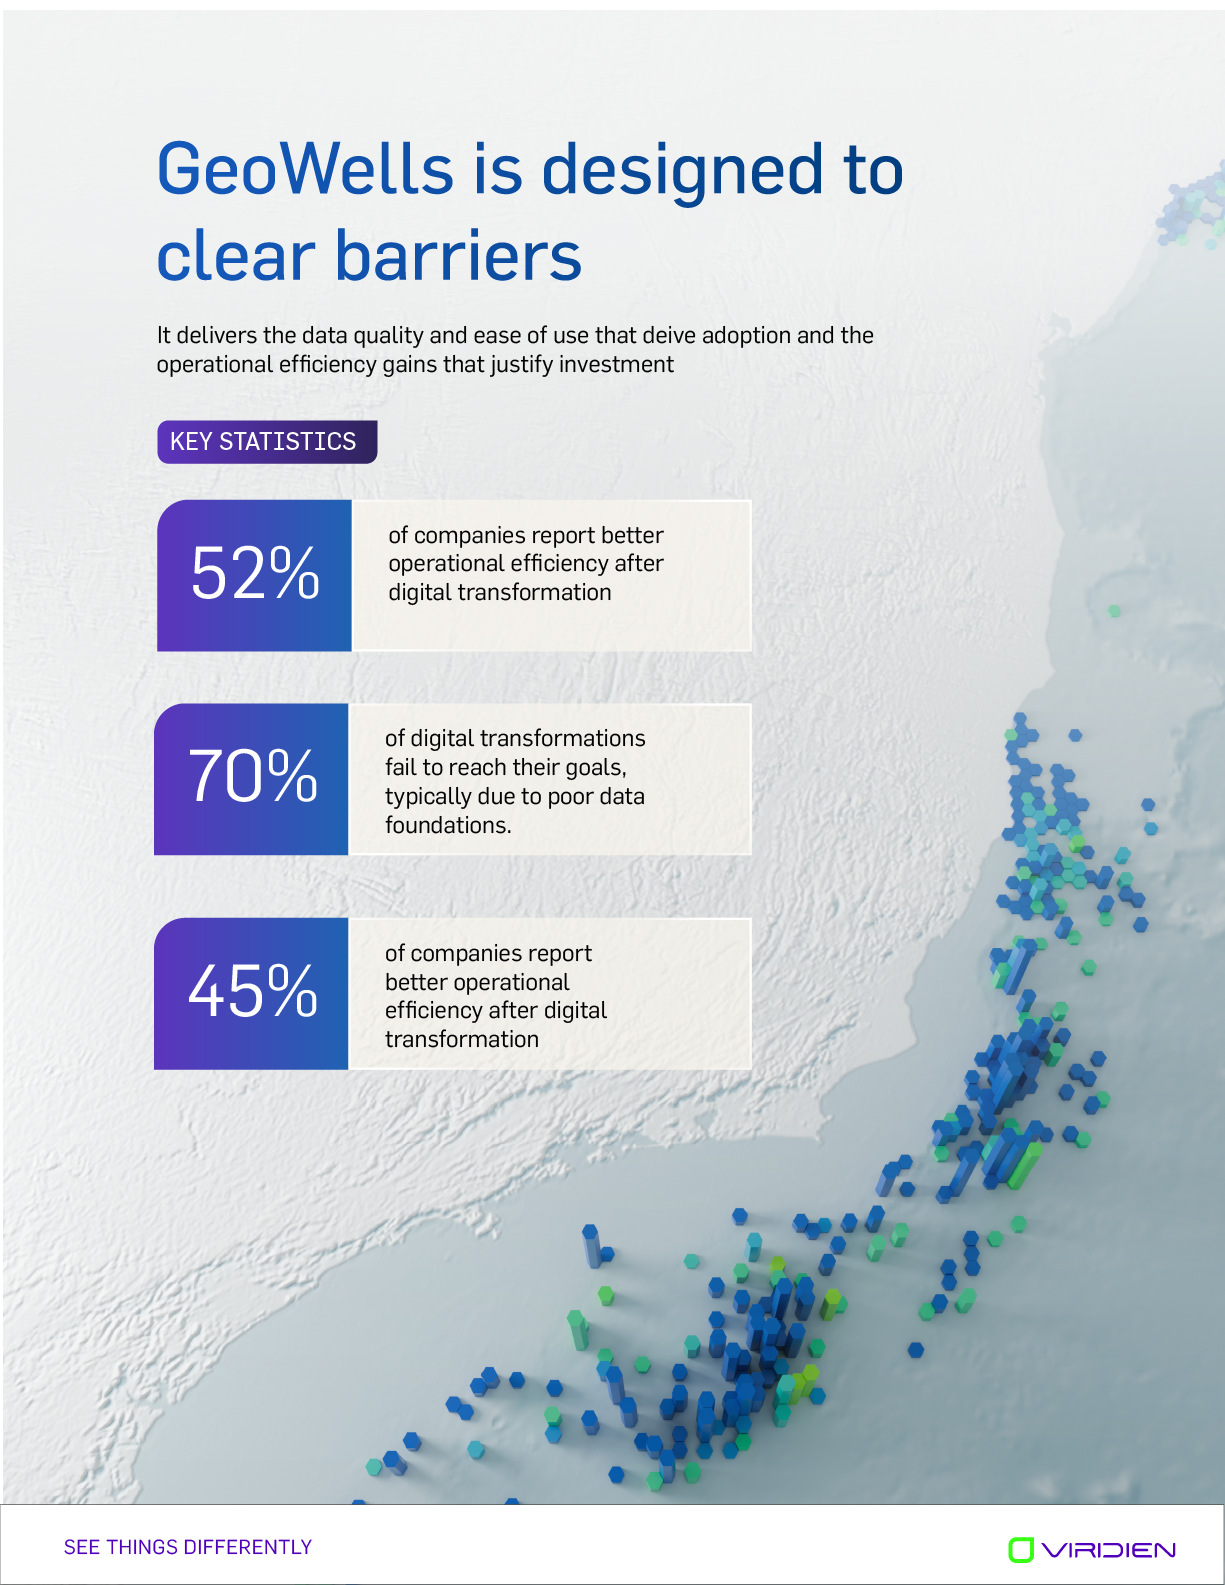
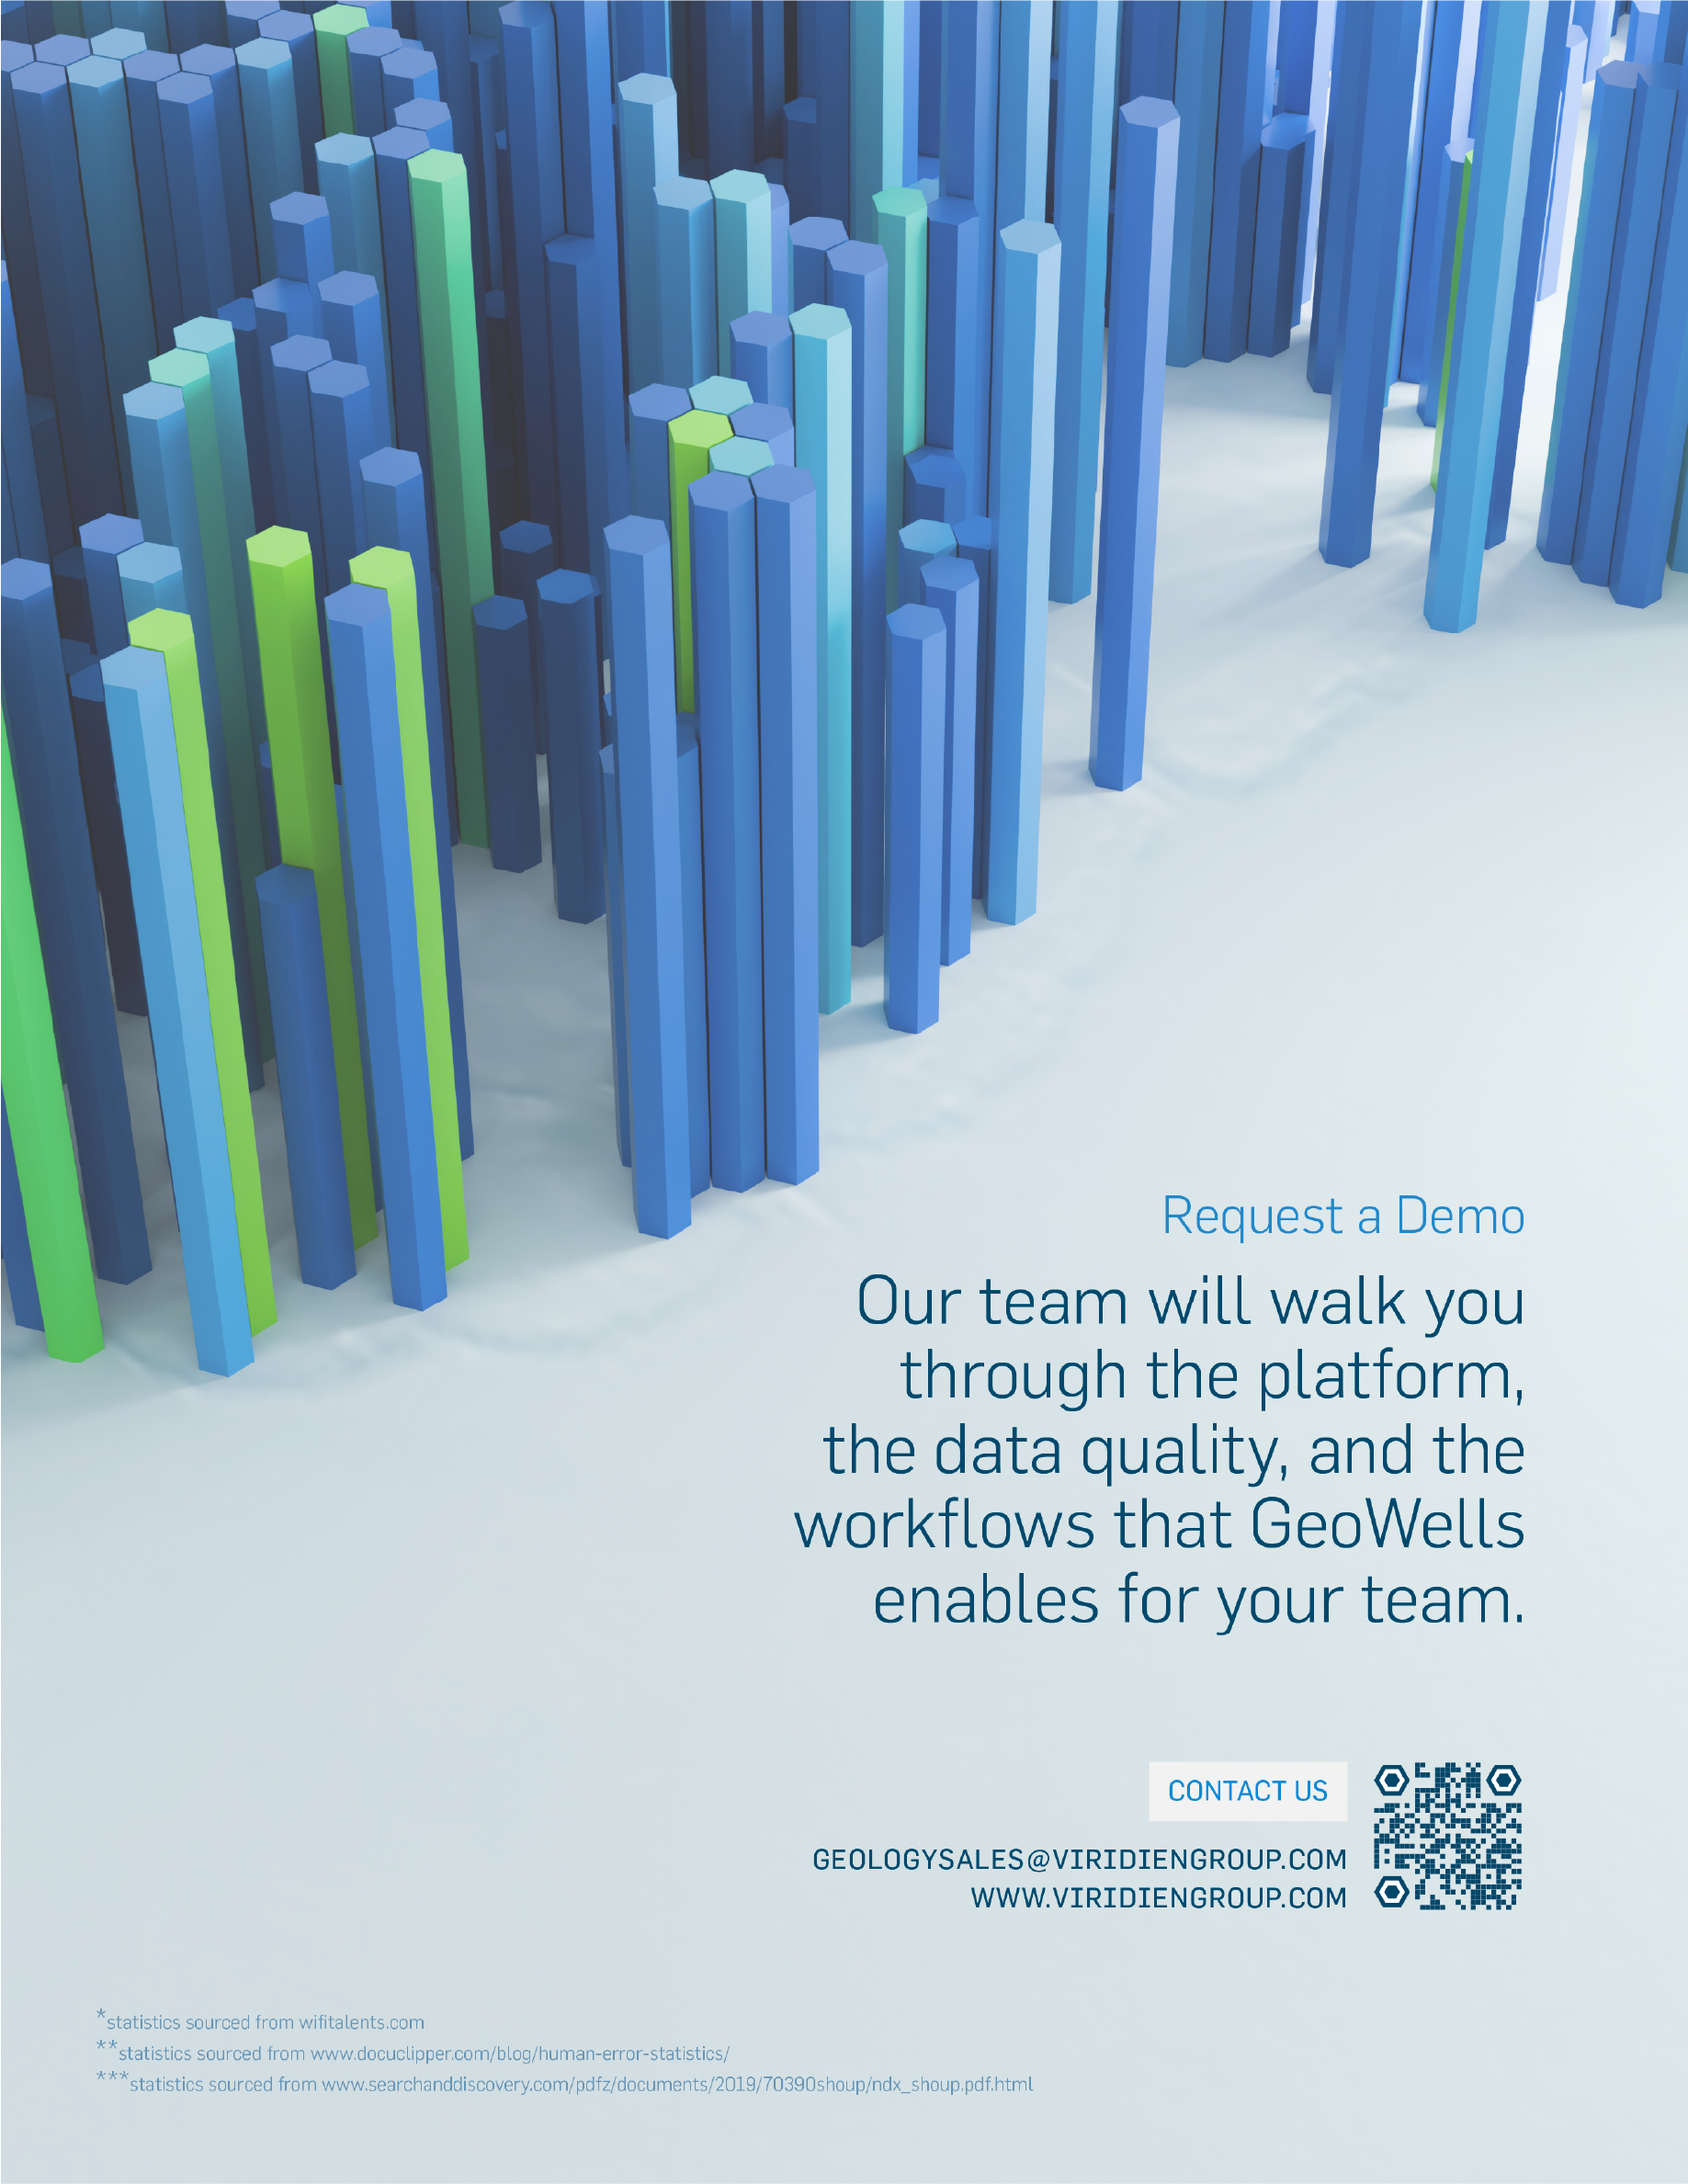
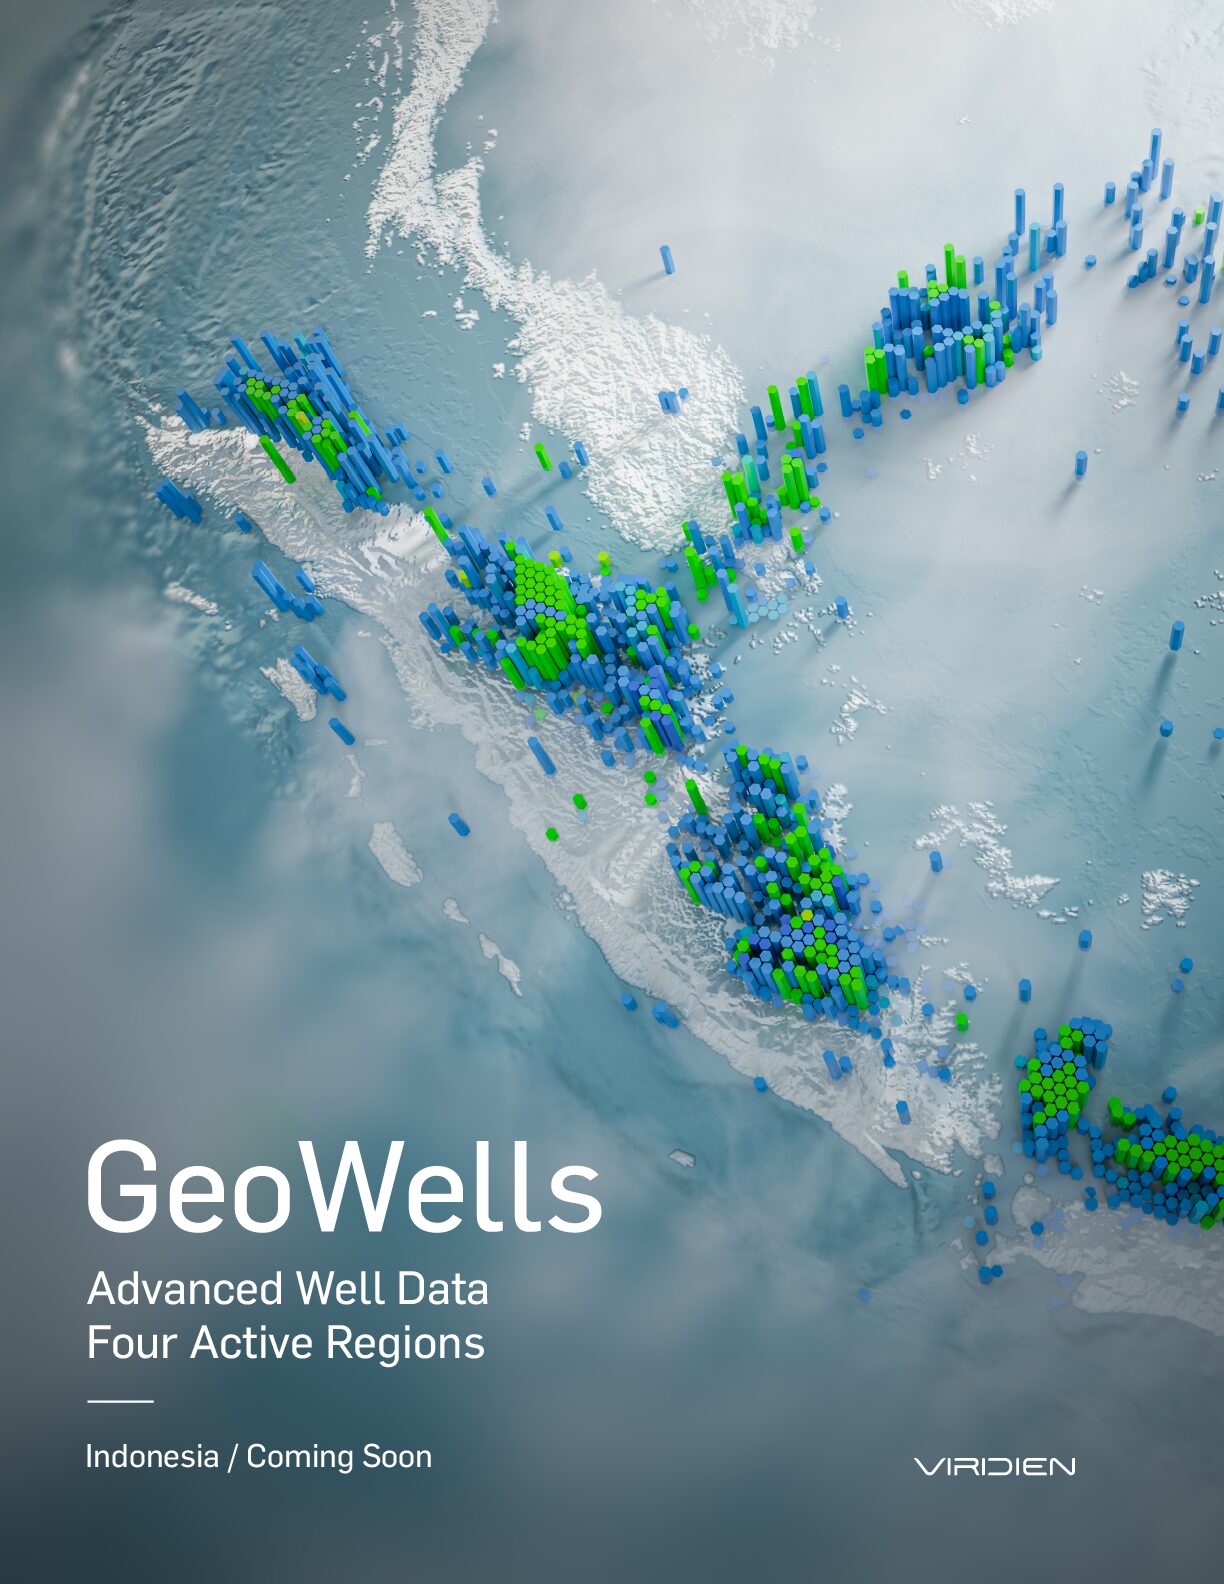
I turned real geospatial data into 3D imagery for an animated video and client brochure. I originated the concept and built the pipeline: .csv → QGIS → Blender, rebuilt as hexagonal geometry via Geometry Nodes and produced the imagery, infographics, and layouts. Developed with Viridien’s sales team and a consulting geologist.
Brochure Designs
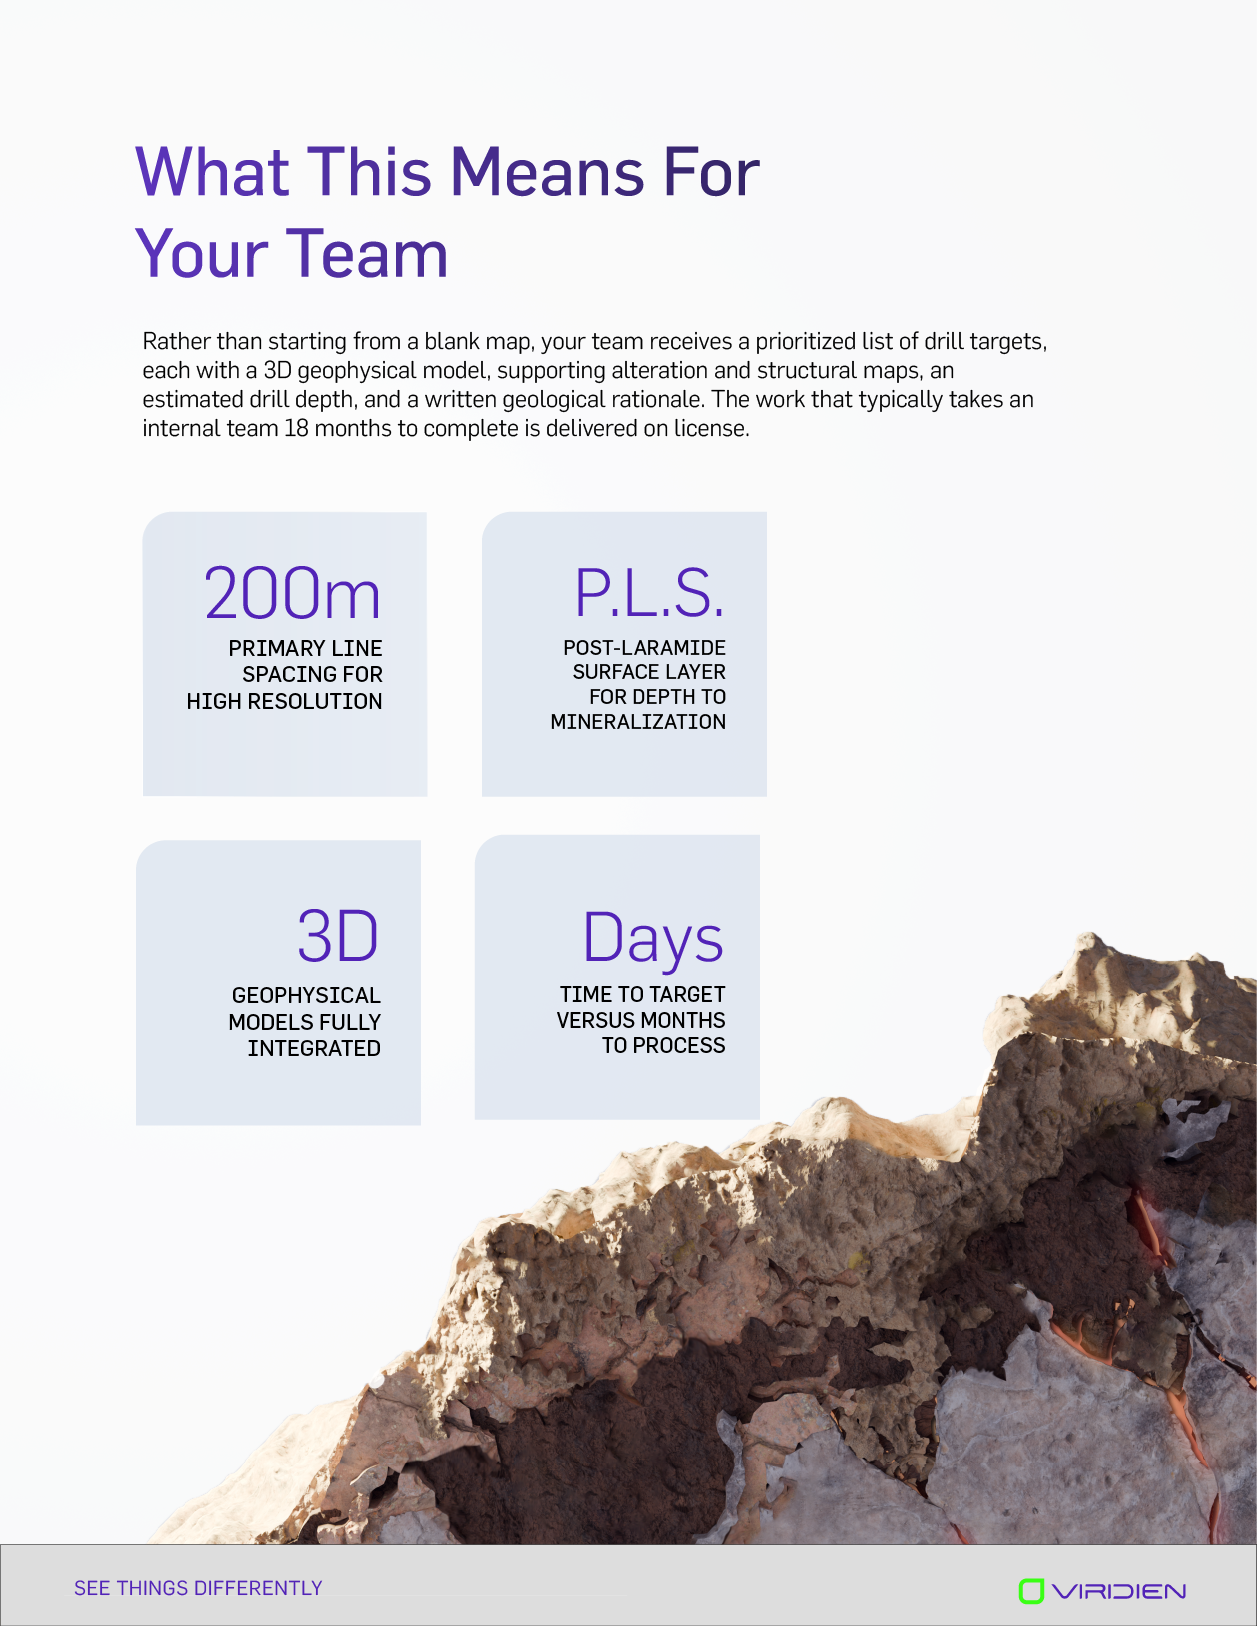
I also designed every layout built around 3D imagery and infographs, composing the final pages within the Viridien visual system along with their graphic designer.
GeoWells Brochure

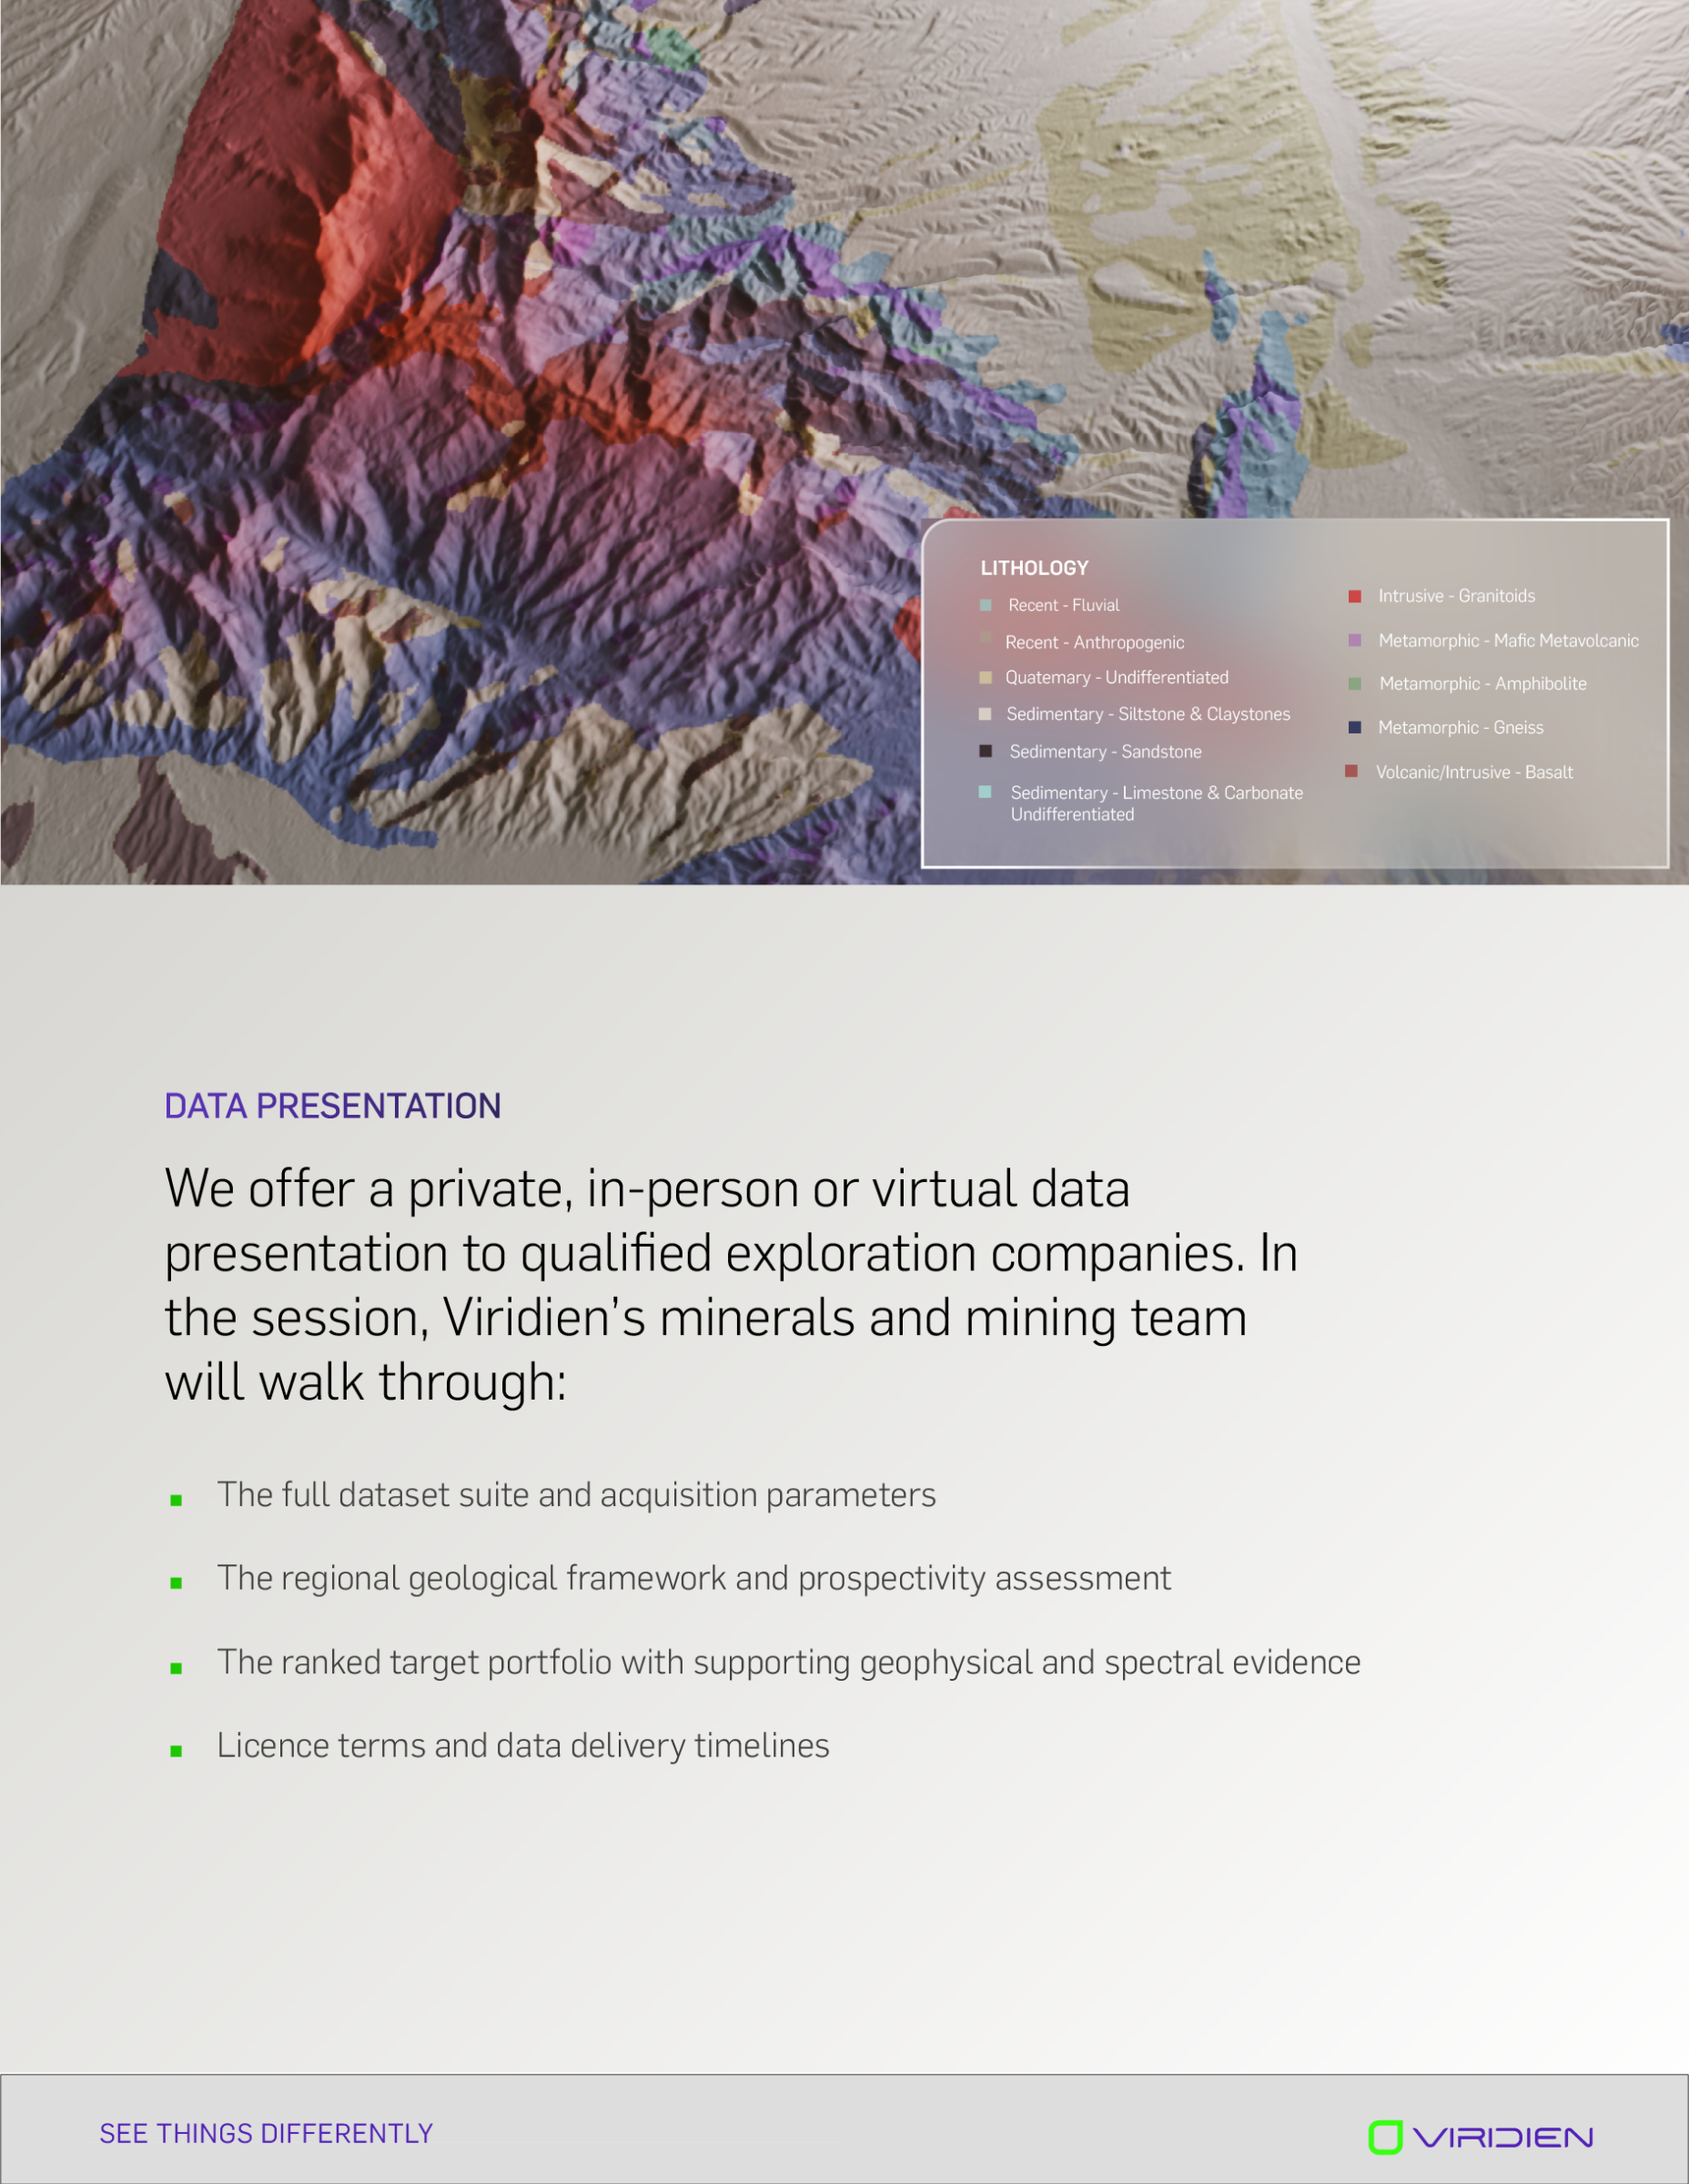
Mining Brochure
Case Study For GEOWELLS
Visualizing data in 3D creative software was a new process for the company. I did a lot of problem-solving through QGIS and Blender to translate real geology data into appealing 3D models.
For GeoWells, I created a hexagonal grid of real wells data in QGIS and then imported it into Blender. I used Geometry Nodes to bring the data to life, using the .csv to attribute the hexagon extrusion. I also created shader attributes to color the data by frequency.

Case Study for Mining
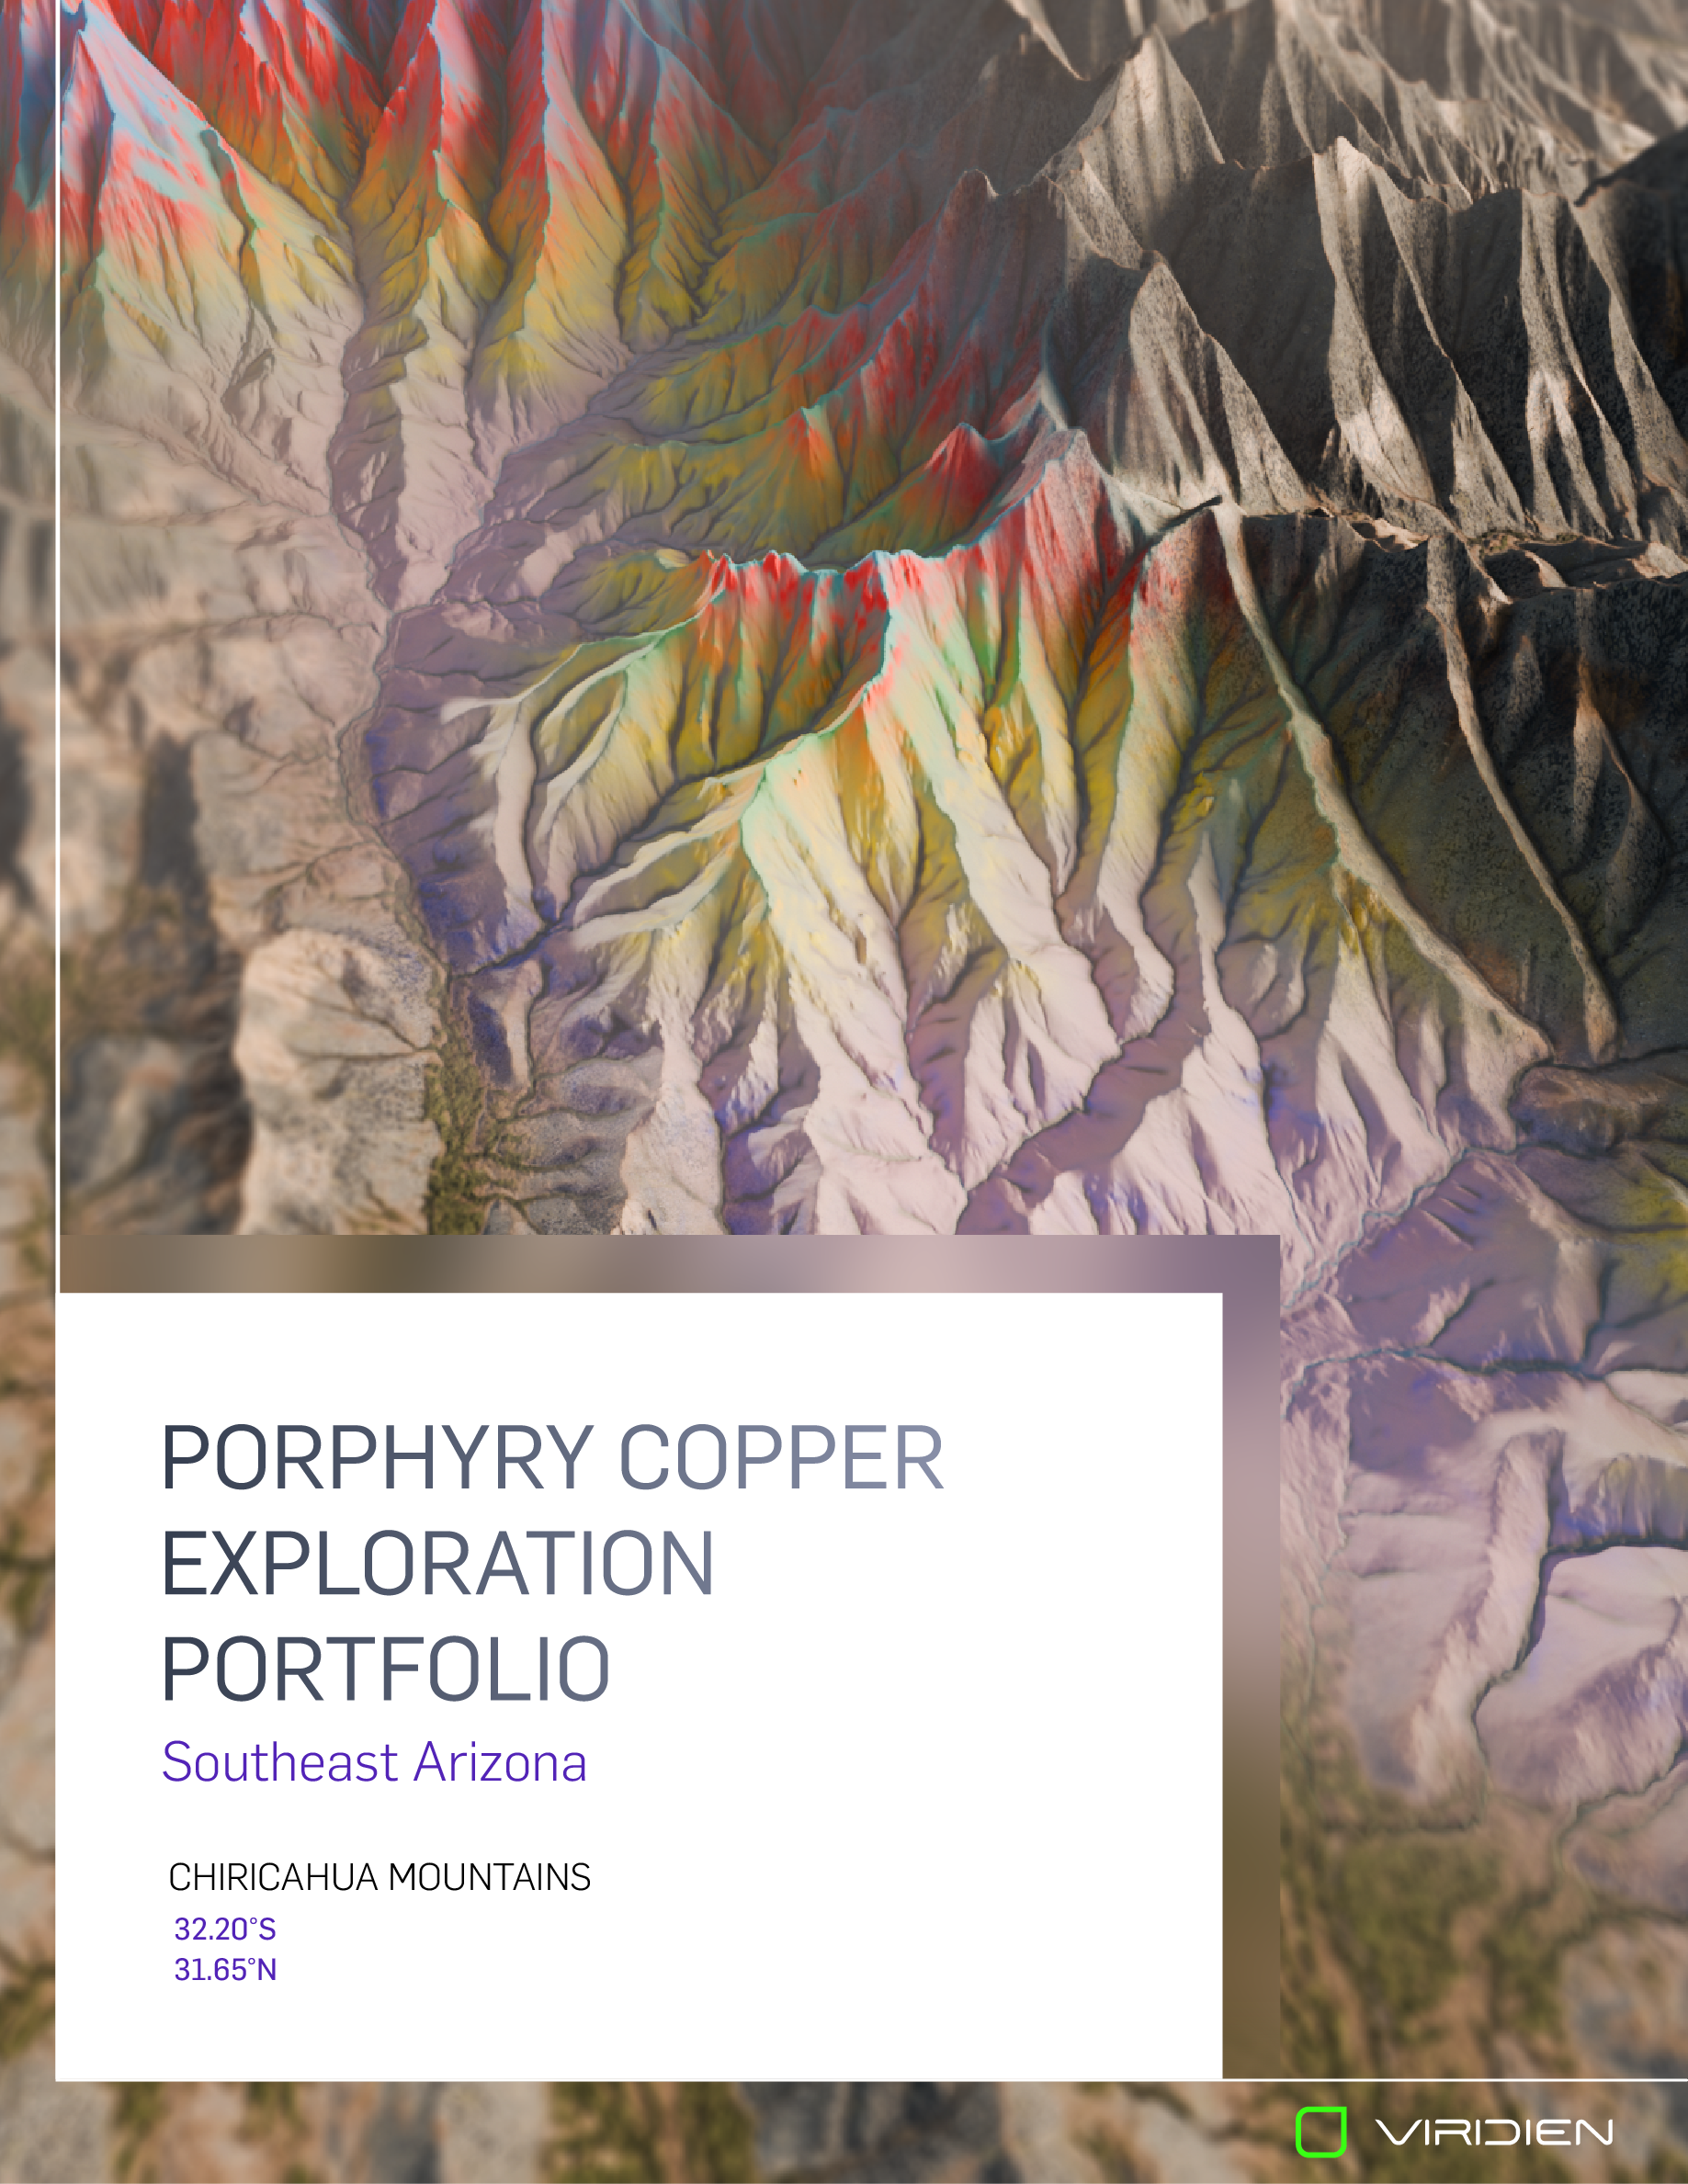
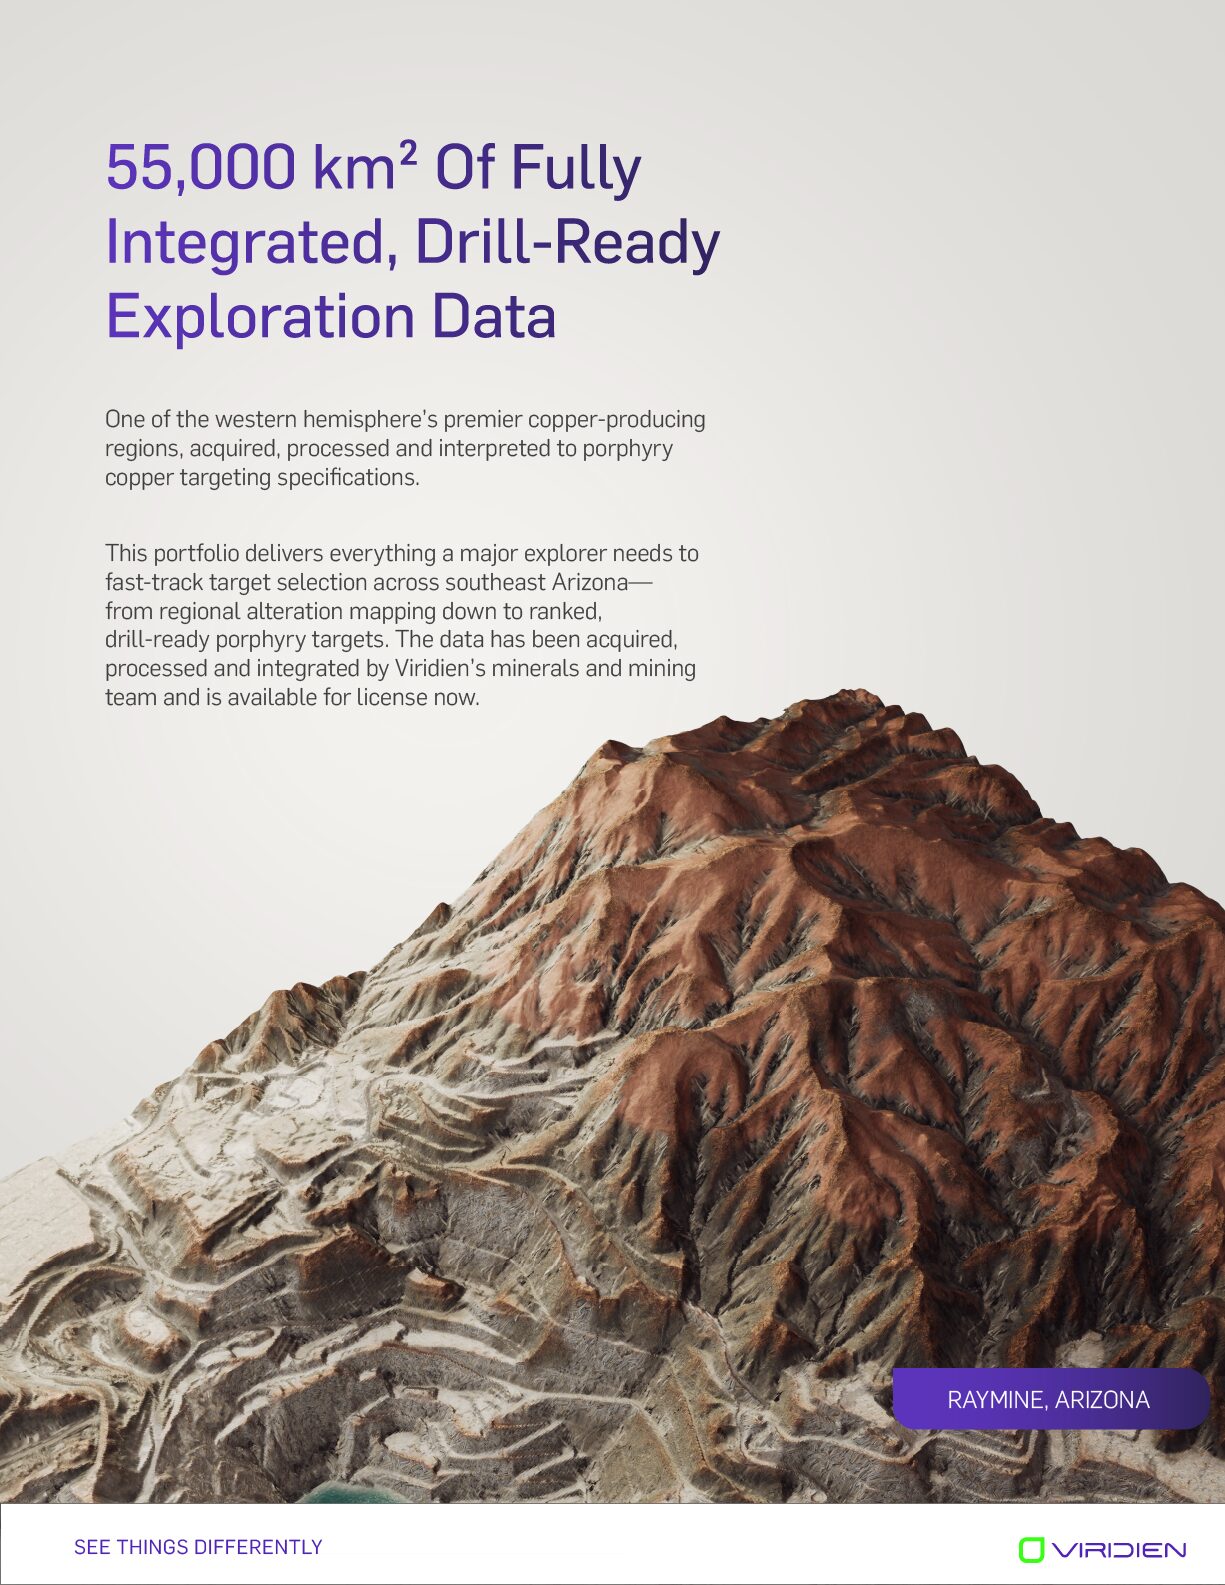
Used .tiff files from real data to problem-solve ways to bring real mining data into appealing 3D renders. QGIS and Blender was used here.


